Location and Hours
Virtual only. Monday–Friday, 8 a.m.–5 p.m. | For support, contact geo@mcw.edu.
Services and Technologies
GEO provides access to 1) geospatial mapping and analysis; 2) cancer epidemiology and database expertise; 3) information on the cancer burden in the Catchment Area; 4) and integrated translational, clinical, and population data.
As part of its data services, GEO houses the Integrated Cancer Data Resource (ICDR). The ICDR facilitates centralized access to real-world data that includes electronic health records data, genomic data (reports and vendor-provided raw sequencing data), and imaging data through close collaboration with the Clinical and Translational Science Institute (CTSI). To access ICDR data, a Data Request Intake Form should be completed.
View the FY26 GEOSR price sheet (PDF)
iLab Requests; Funding Support
iLab Requests and Support
Funding Support
Investigators should first utilize all available funding resources (below). If funding support is still needed, contact the Shared Resource Director to discuss Cancer Center support.
- Grant Funding (internal or external)
- Cancer Center Pilot Grants
- Start-up Funding
- Departmental Support
Shared Resource Acknowledgement
Use of MCW Cancer Center-supported Shared Resources must be acknowledged in publications. These acknowledgments allow the Cancer Center to track Shared Resource productivity, impact, and service to members.
View Shared Resource acknowledgement instructions. (PDF)
To cite the GEOSR in academic products, include RRID:SCR_027585 in the Acknowledgments. Example: This work was supported by the Medical College of Wisconsin Cancer Center Geospatial, Epidemiology and Outcomes Shared Resource Core Facility (RRID:SCR_027585).
We Value Your Feedback
Geospatial Data Resources
Leadership

Kirsten Beyer, PhD, MPH, MS
Co-Director, Geospatial, Epidemiology and Outcomes Shared Resource (GEOSR)

Anai Kothari, MD, MS
Co-Director, Geospatial, Epidemiology and Outcomes Shared Resource (GEOSR)

Tina Yen, MD, MS, FACS, FSSO
Co-Director, Geospatial, Epidemiology and Outcomes Shared Resource (GEOSR)
Faculty and Staff


Notable Publications
Understanding unrealized trial enrollments following patient-to-trial matching with large language models. (Verhagen CT, Westerman G, Heaviland H, Lynch E, Brandenburg O, Adams-Patton J, Schwind R, Seo YD, Clarke CN, George B, Kothari AN) Surgery. 2025 NOV 30; PMID: 41318261; DOI: 10.1016/j.surg.2025.109915; Scopus ID: 2-s2.0-105026193777
Geographic access to lung cancer screening and environmental lung cancer risk factors in the contiguous United States. (Anyanwu C, Yang K, Bonne V, Kalkbrenner AE, Kostelac C, Beyer KMM) Health Place. 2025 NOV 29; PMID: 41313940; DOI: 10.1016/j.healthplace.2025.103588
Multiple myeloma incidence, transplant utilization, and mortality- impact of social vulnerability. (Wu JF, Estrada-Merly N, Zhou Y, Canales B, Yen TWF, D'Souza A) Bone Marrow Transplantation. 2025 OCT 14; PMID: 41083569; PMCID: PMC12590446; DOI: 10.1038/s41409-025-02733-9; Scopus ID: 2-s2.0-105018757703
Cumulative neighborhood disadvantage and racial and geographic disparities in epigenetic aging. (Xu W, Kamis C, Clark J, Schultz A, Engelman M, Malecki K) SSM Popul Health. 2025 JUL 01; PMID: 40584435; PMCID: PMC12206060; DOI: 10.1016/j.ssmph.2025.101825; Scopus ID: 2-s2.0-105007938886Contemporary neighborhood redlining and racial mortgage lending bias and disparities in prostate cancer survival. (Lawrence WR, Freedman ND, McGee-Avila JK, Hong HG, Gomez SL, Loehrer AP, Beyer KMM, Zhou Y, Magnani JW, Neighbors HW, Johnson JA, Lin Z, Davidoff AJ, Llanos AAM, Shiels MS) Cancer. 2025 APR 15; PMID: 40233138; PMCID: PMC12001745; Scopus ID: 2-s2.0-105002708265
Effects of urban greenspace on time to major adverse cardiovascular events among women with breast cancer in the US: Insights from the Greater Milwaukee, WI Area. (Bikomeye JC, Tarima S, Zhou Y, Kwarteng JL, Beyer AM, Yen TWF, Winn AN, Beyer KMM) Health Place. 2025 APR 06; PMID: 40187121; DOI: 10.1016/j.healthplace.2025.103460; Scopus ID: 2-s2.0-105001825932
Characterizing the Impact of Race and Contemporary Redlining on Receipt of Guideline-Concordant Locoregional Therapy Among Older Women With Breast Cancer. (Beltrán Ponce S, Canales B, McGinley EL, Yen TWF, Tarima S, Zhou Y, Bikomeye JC, Beyer KMM) Adv Radiat Oncol. 2025 FEB 01; DOI: 10.1016/j.adro.2024.101688; Scopus ID: 2-s2.0-85214202142
PRISM: Patient Records Interpretation for Semantic clinical trial Matching system using large language models. (Gupta S, Basu A, Nievas M, Thomas J, Wolfrath N, Ramamurthi A, Taylor B, Kothari AN, Schwind R, Miller TM, Nadaf-Rahrov S, Wang Y, Singh H) NPJ Digit Med. 2024 OCT 29; PMID: 39468259; PMCID: PMC11519882; DOI: 10.1038/s41746-024-01274-7; Scopus ID: 2-s2.0-85208118725
The health risk of social disadvantage is transplantable into a new host. (Turcotte LM, Wang T, Beyer KM, Cole SW, Spellman SR, Allbee-Johnson M, Williams E, Zhou Y, Verneris MR, Rizzo JD, Knight JM) Proc Natl Acad Sci U S A. 2024 JUL 23; 121(30):e2404108121. PMID: 39008669; PMCID: PMC11287259; DOI: 10.1073/pnas.2404108121; Scopus ID: 2-s2.0-85199015473
The health implications of cumulative exposure to contextual (dis)advantage: methodological and substantive advances from a unique data linkage. (Xu W, Kamis C, Agnew M, Schultz A, Salas S, Malecki K, Engelman M) Am J Epidemiol. 2024 JUL 08; PMID: 38973742; PMCID: PMC11815491; DOI: 10.1093/aje/kwae183; Scopus ID: 2-s2.0-85217882845
Effects of housing stability and contemporary mortgage lending bias on breast cancer stage at diagnosis among older women in the United States. (Rademacher N, Zhou Y, McGinley EL, Laud PW, Yen TWF, Ponce SB, Nattinger AB (CC), Beyer KMM) Cancer Med. 2024 JUL 01; 13(14):e7397. PMID: 39030995; PMCID: PMC11258551; DOI: 10.1002/cam4.7397; Scopus ID: 2-s2.0-85199018217
Severity of prior coronavirus disease 2019 is associated with postoperative outcomes after major inpatient surgery. (Verhagen NB, SenthilKumar G, Jaraczewski T, Koerber NK, Merrill JR, Flitcroft MA, Szabo A, Banerjee A, Yang X, Taylor BW, Figueroa Castro CE, Yen TWF, Clarke CN, Lauer K, Pfeifer KJ, Gould JC, Kothari AN, N3C Consortium) Ann Surg. 2023 NOV 01; 278(5):e949-e956. PMID: 37476995; PMCID: PMC10659141; DOI: 10.1097/SLA.0000000000006035; Scopus ID: 2-s2.0-85173563272
Isolation and survival: The impact of local and MSA isolation on survival among non-Hispanic Black women diagnosed with breast cancer in the United States using a SEER-Medicare cohort. (Canales B, Laud PW, Tarima S, Zhou Y, Bikomeye JC, McGinley EL, Yen TWF, Bemanian A, Beyer KMM) Health Place. 2023 SEP; 83:103090. PMID: 37531804; PMCID: PMC10528833; Scopus ID: 2-s2.0-85166298261
Historical redlining and breast cancer treatment and survival among older women in the United States. (Bikomeye JC, Zhou Y, McGinley EL, Canales B, Yen TWF, Tarima S, Ponce SB, Beyer KMM) J Natl Cancer Inst. 2023 JUN 08; 115(6):652-661. PMID: 36794919; PMCID: PMC10248836; DOI: 10.1093/jnci/djad034; Scopus ID: 2-s2.0-85163239340
Vaccination against SARS-CoV-2 decreases risk of adverse events in patients who develop COVID-19 following cancer surgery. (Verhagen NB, Koerber NK, Szabo A, Taylor B, Wainaina JN, Evans DB, Kothari AN, N3C Consortium) Ann Surg Oncol. 2023 MAR; 30(3):1305-1308. PMID: 36479662; PMCID: PMC9734328; Scopus ID: 2-s2.0-85143492422
Mortgage lending bias and breast cancer survival among older women in the United States. (Beyer KMM, Zhou Y, Laud PW, McGinley EL, Yen TWF, Jankowski C, Rademacher N, Namin S, Kwarteng J, Beltrán Ponce S, Nattinger AB) J Clin Oncol. 2021 SEP 01; 39(25):2749-2757. PMID: 34129388; PMCID: PMC8407650; Scopus ID: 2-s2.0-85115440319
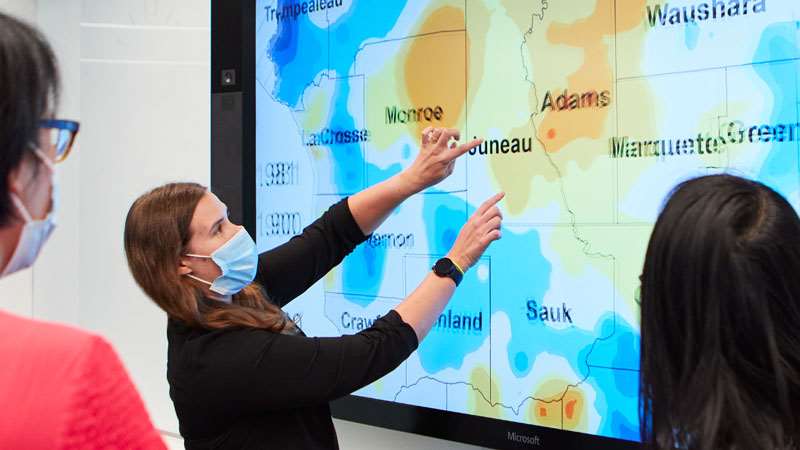
Sample Illustration: Wisconsin Lung Cancer Incidence, 2010-2015
Red areas on the map indicate higher rates than expected and blue areas indicate lower rates than expected, given the regional rate. Areas without color exhibit rates close to the regional rate.
The “Percent Minority” layer displays the percent of people who identify as a minority in each Census Tract. This layer is only visible at a higher zoom level. Different layers can be selected and overlapped to observe patterns.
Data were obtained from the American Cancer Society (ACS) 2012-2016 estimates and a mapping tool developed by the Environmental Protection Agency.